BlogVolume
Volume profile: how to read the POC and the value area
How to read a volume profile: POC, VAH and VAL, how the 70% value area is calculated, which range to pick for a fixed range volume profile, and its limits.

Contents
A volume profile is a histogram of volume by price: the volume under the chart turned on its side along the price scale. You read it by three levels: the POC, where the range traded the most; the value area around it, holding 70% of the volume; and its edges, the VAH and VAL. Inside the value area the market is in balance, and a move past an edge means it's looking for a new price.
The volume bars under a chart tell you when the market traded, and a profile tells you at what price. You can see at a glance where most of the trading happened over a range and which prices the market skipped through with hardly any trades.
What a profile is made of: POC, VAH and VAL
The price range is split into rows, and the length of each row is the volume traded in that band. The rows give you three levels:
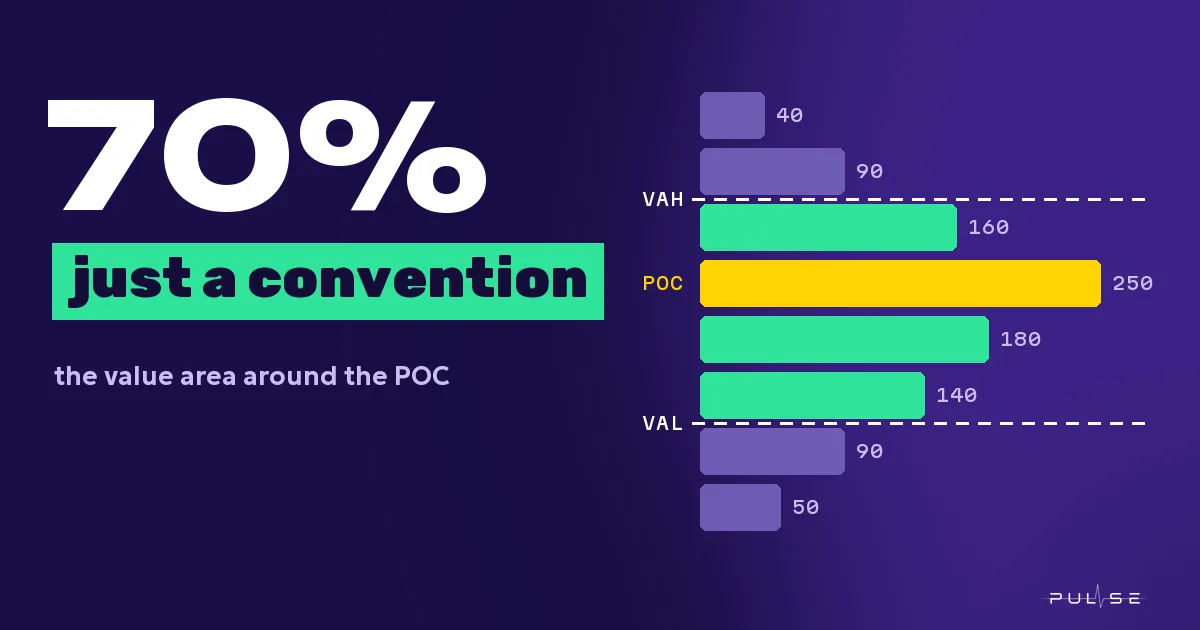
- POC (point of control): the row with the most volume, the price where the range traded the most.
- Value area: the bands around the POC that hold 70% of the total volume.
- VAH and VAL: the high and the low of the value area.
The 70% is just a convention. It's close to the share of a normal distribution within one standard deviation of the middle, which is 68.27% according to the NIST statistics handbook. You can change it, but then your levels stop matching what everyone else sees.
How the value area is calculated
The value area is built out from the POC: you keep adding whichever neighbouring row, above or below, holds more volume until you reach 70% of the total.
Take a made-up BTCUSDT range: eight rows of $100 each, 1,000 BTC in total.
| Row | Volume, BTC | Step |
|---|---|---|
| 64,700–64,800 | 40 | |
| 64,600–64,700 | 90 | |
| 64,500–64,600 | 160 | 3 |
| 64,400–64,500 | 250 | 1, POC |
| 64,300–64,400 | 180 | 2 |
| 64,200–64,300 | 140 | 4 |
| 64,100–64,200 | 90 | |
| 64,000–64,100 | 50 |
You start at the POC: 250 BTC. Its neighbours are 160 above and 180 below; 180 is bigger, so you go down: 430. Next it's 160 against 140, so up: 590. Then 90 against 140, down again: 730. That is past 700, which is 70% of 1,000, so you stop.
- POC, middle of the row
- 64,450
- VAH, top of the area
- 64,600
- VAL, bottom of the area
- 64,200
- Inside the value area
- 730 BTC, 73%
The area ends up slightly above 70% because rows are added whole.
How to read a volume profile
A profile won't tell you where price goes next. It shows where traders have already agreed on price, and that helps you place an entry, a stop and a target.
- Inside the value area the market is in balance and price rotates from edge to edge. An entry in the middle gets you a short target for the same stop.
- Above the VAH or below the VAL the market is looking for a new price. If price comes straight back into the area, the breakout was rejected. If it holds outside and volume builds there, the new price was accepted, and the old edge tends to turn into support or resistance.
- Thin parts of the profile, where little volume traded (low volume nodes, LVN), usually get crossed fast: there were hardly any trades there, so there is nothing to hold price. Thick parts (high volume nodes, HVN) slow it down.
- A POC from an earlier period that price hasn't touched since is called a "naked" POC. It's worth watching when price gets close to one.
A stop is better tucked behind the edge of the area or behind a thick part than left in the middle of a thin one, where price flies through without stopping. Once you know where the stop goes, size the position from risk, as in the article on lot size from risk. To see how entries at the edges of the area worked on your ticker before, run them through a manual backtest.
Fixed range volume profile: which range to pick
For a fixed range volume profile, pick a stretch where the market behaved one way: a session, a range, an impulse or a week. A session profile is built for each day separately, and a visible range profile takes whatever is on screen. The fixed range is the one you choose yourself, and everything else depends on that choice:
- a session or a day, to see where the market traded yesterday;
- a range between two impulse moves: its POC and edges show where positions were built;
- an impulse from low to high: the thin spots show where price moved with almost no trades;
- a week, if you hold trades for several days.
A common mistake is to put a trend and a range into one profile. The POC lands where the market only paused briefly, and the real balance area gets lost in the total.
The row count changes the picture too. Too few rows and the profile is coarse, with the POC smeared over a wide band. Too many and each row gets a couple of bars, so instead of a distribution you get a comb.
What counts as volume in forex and crypto
On a crypto exchange the volume is real: the coins or contracts that changed hands, the same trades you see on the tape next to the order book. A forex or CFD broker has no trade feed, so the volume there is tick volume, the number of quote changes in a bar. A tick profile still shows where the market was busier, but it isn't contracts or money, and you can't compare it directly with an exchange profile.
The second caveat is the candles themselves. A candle knows the volume of the bar but not the prices inside the bar where it traded. So the bar's volume gets spread across its range: the more the bar overlaps a row, the more volume that row gets. On one-minute bars this is close to reality. On daily bars it's rough.
How to build a profile in Pulse Terminal
Pulse Terminal is a trading terminal for Windows, and its "Volume profile" tool sits in the "Volume" group of the drawing tools bar, hotkey Alt+O. The first click sets the start of the range, the second sets the end. Vertically the profile takes the low and high of the bars in the range by itself and draws the bands, the POC, VAH and VAL lines and the value area.
Here is how the terminal deals with the second caveat. On a chart above one minute it loads one-minute bars for the profile, as long as the range is no longer than 20,000 minutes, just under two calendar weeks. A longer range is calculated from the chart's own bars and comes out coarser.
Profile settings
In the object's settings:
- "Rows layout": "By row count" (24 out of the box) or "By ticks", where you set the row height in price steps;
- "Volume": "Up/Down", "Total" or "Delta". Up and down here follow the direction of the bar, not the aggressor of each trade. For buys and sells at each price from real trades, use the "Footprint" chart type;
- "Value area volume": 70% out of the box;
- "Developing POC" and "Developing value area": polylines showing where the levels stood on every bar of the range. If the POC steps up, the fair price moved with the rally. If it stays put, the market was in balance;
- "Extend right": the profile box stretches to the right edge, so the levels stay visible on new bars.
The profile is a drawing, and drawings in Pulse belong to the ticker at your broker rather than to one chart. A profile drawn on the hourly chart shows up on the five-minute one too.
Two more tools sit next to it. "Anchored VWAP" (Alt+W) is the volume-weighted average price from the bar you pick to the end of the data, with 1σ–3σ bands. The "TPO — time at price" indicator builds the same kind of profile, except a row's length is the time price spent at that level, per session, week, last N bars or the visible part of the chart. It has a "Naked POC touch" alert: the terminal tells you when price reaches the POC of an earlier period it hasn't touched yet.
FAQ
What is the POC in trading?
The POC (point of control) is the price where the most volume traded over the chosen range, the longest row of the profile. A POC from an earlier period that price hasn't touched since is called a "naked" POC.
Why is the value area 70%?
It's a convention. 70% is close to the share a normal distribution covers within one standard deviation either side of the middle, about 68%. You can change it, but then your levels will differ from the ones everyone else sees.
How is a profile different from regular volume?
Regular volume is the bars under the chart: how much traded in each bar. A profile spreads the same volume across prices: how much traded at each level over the whole range.
Does volume profile work in forex?
It does, but it's built from tick volume, the number of quote changes, rather than contracts. It shows where the market was busier, and it can't be compared directly with an exchange profile.
How is a volume profile different from TPO?
In a volume profile a row's length is the volume at that price. In TPO it's the time price spent at the level. Where the two disagree, price either sat for a long time with few trades or moved quickly through heavy volume.
The numbers in this article are worked examples, not trading advice. Trading on financial markets carries a risk of losing money.