BlogBacktest
Manual backtesting: test a strategy on history in an evening
What backtesting is, how manual testing differs from a strategy tester, how to do it step by step, how long a month takes and how to read the result in R.

Contents
Manual backtesting tests a strategy on history without code. You stand at a chosen point in the past, see only the bars before it, move time forward and trade as if the future has not happened yet. A month of five-minute bars at normal speed takes about three and a half hours, which is one evening, and the result is counted in multiples of risk.
What backtesting is
Backtesting is a test of trading rules on past data: how the strategy would have traded if you had applied it back then. It tells you whether the rules have an edge over a long run before you risk money.
There are automated and manual ways to test on history:
| Strategy tester | Manual testing | |
|---|---|---|
| What it tests | rules written as code | any trading, including levels and context |
| Code needed | yes | no |
| Speed | years of history in minutes | a month in an evening |
| Weak spot | fitting parameters to history | few trades and fatigue |
A strategy tester fits when an entry can be written as a formula: a moving average crossover, a channel breakout. If you enter on levels, market structure or the news backdrop, that is hard to code. Then the way left is to stand in the past and trade by hand.
How to backtest a trading strategy by hand
- Write the rules down before you start: entry, stop, target, risk per trade. Rules made up along the way test your memory, not the strategy.
- Pick the instrument and timeframe you trade live.
- Start from a random date, not from a period you remember well.
- Set costs: commission, spread and swap, as on your account.
- Move time forward bar by bar and trade only on what is visible left of the cursor.
- Collect at least 30 trades, better 100: over ten trades, luck decides the result.
- Count the result in R and compare it with how you trade live.
Mistakes that make testing on history lie
The most common mistake is peeking ahead. Seeing once where the price went is enough, and the next decisions are no longer honest. So the future on the chart has to stay hidden, and a step back has to wipe the result.
The second mistake is testing without costs. On small moves commission and spread easily turn a small gain into a loss, especially on one-minute charts.
The third is overfitting. The more rule variants you try on the same history, the higher the chance that the best one is simply tuned to that data. The study by Bailey, Borwein, López de Prado and Zhu, "The Probability of Backtest Overfitting" (Journal of Computational Finance, 2016), shows this. The defence is to try fewer variants: write the rules in advance and don't change them mid-run. A stretch of history held back for checking helps, but, as the authors show, it doesn't guarantee an honest result either.
How to read the result
The result is easiest to read in R, multiples of risk: a trade that risks $50 and makes $100 is +2R. A sample run:
- Winners
- 12 of 30
- Average win
- +2R
- Average loss
- −1R
- 12 × 2 − 18 × 1
- +6R
- Per trade
- +0.2R
- At $50 risk per trade
- +$300
With these numbers the system makes money at 40% winners. But 30 trades is a small sample, and on small moves commission easily turns a small gain into a loss. Expectancy per trade in R doesn't depend on position size, so you can compare it between runs with different balances. How to set the risk in money is covered in the article on how to calculate lot size from risk.
Testing on history in Pulse Terminal: start and speed
Pulse Terminal is a trading terminal for Windows with manual testing on history built into the ordinary chart. The mode is simply called Backtest. Orders go to a paper account inside the terminal. They can't reach a broker or an exchange: the trading module carries a BT tag the whole time, and the footer shows a BACKTEST label.
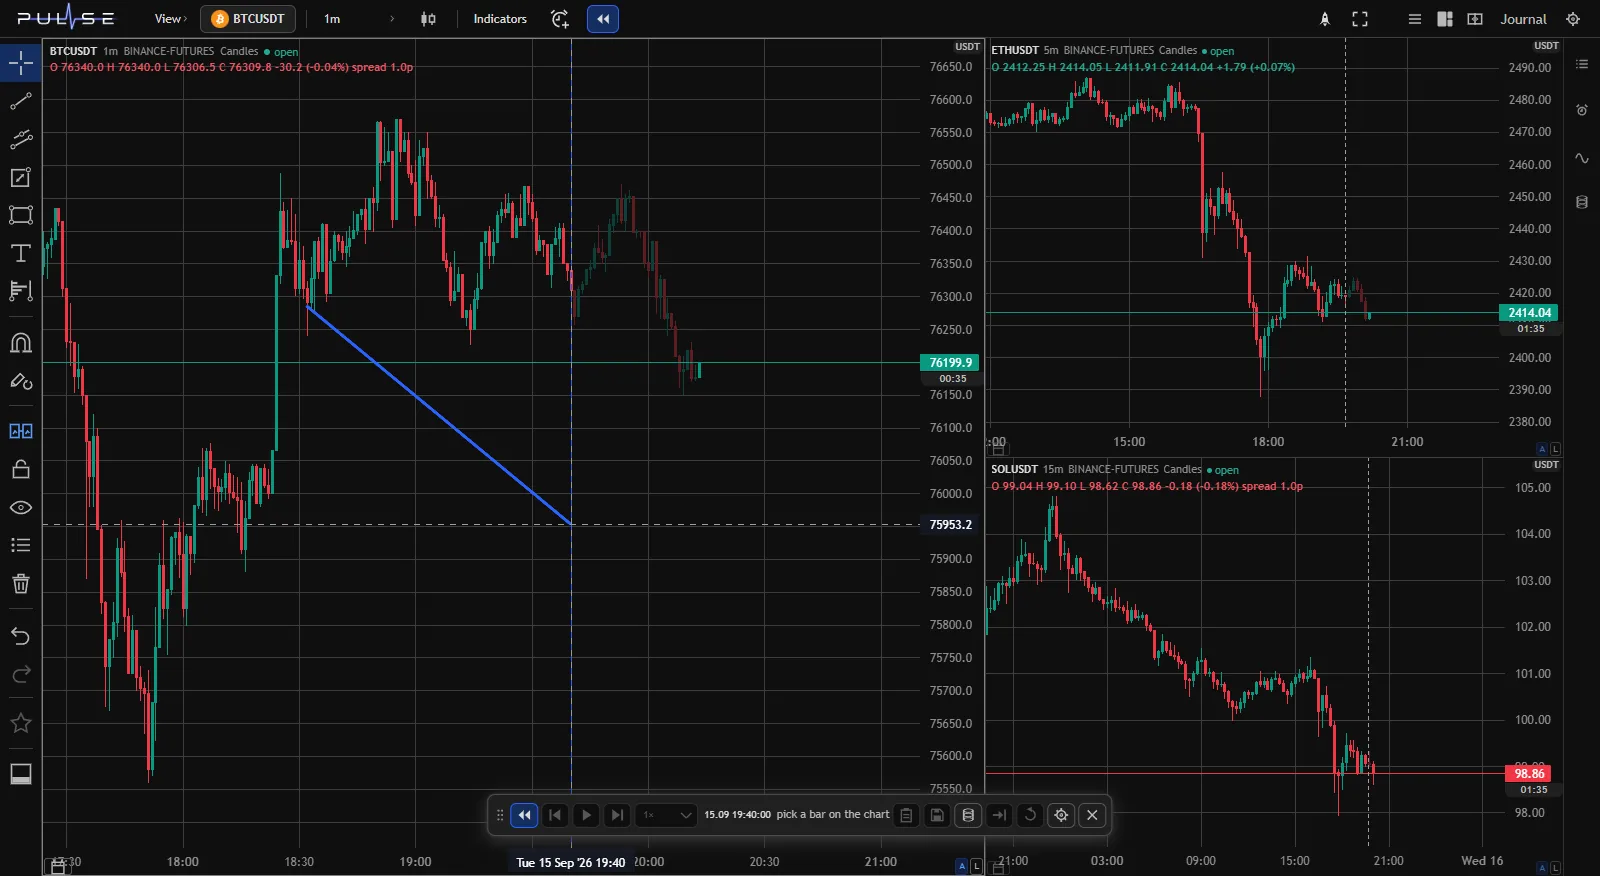
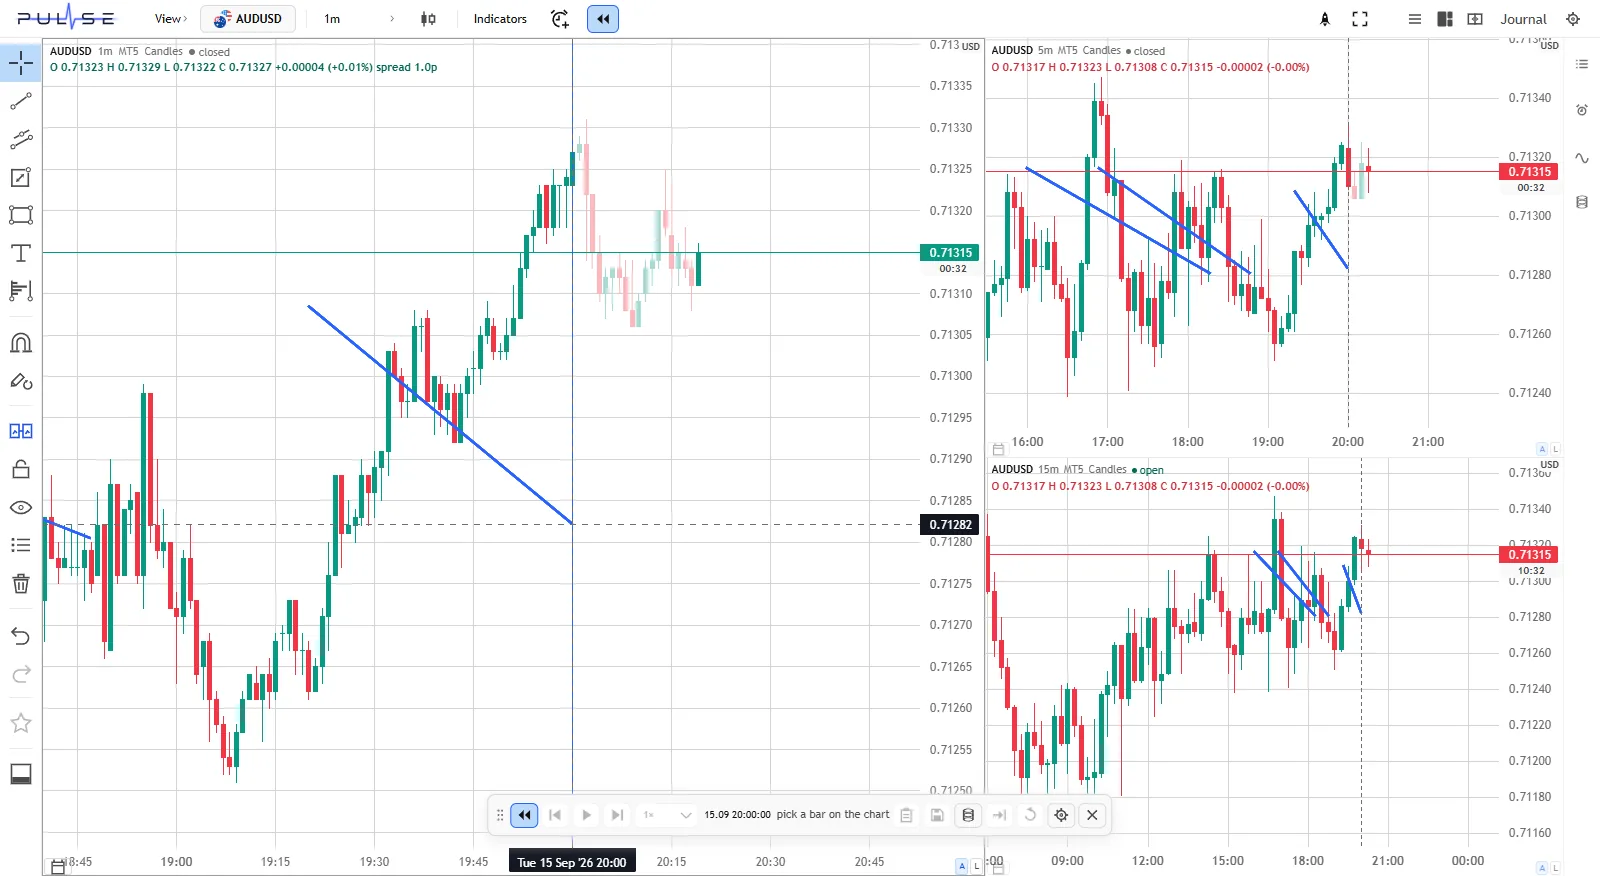
There are five starting points:
- "Bar": click a bar on the chart. Bars to the right of the selection line are dimmed.
- "Date…": a window for picking the day and time.
- "First available date": the very start of the ticker's history at your broker.
- "Random bar": a random minute of history, for testing on a stretch you remember nothing about.
- "Continue last": from the minute you left off, with your account and trades as they were.
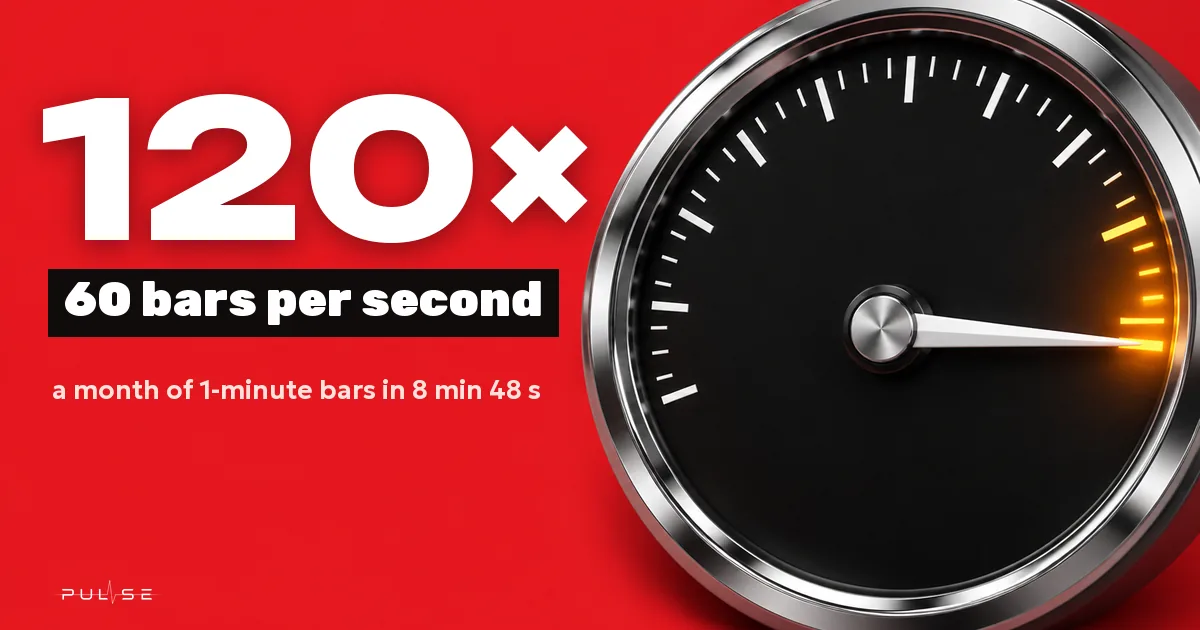
Speed is measured in bars: 1× is one bar every two seconds, and the rest are multiples, so 120× is 60 bars per second. Take a forex trading month of 22 days at 24 hours each:
| Timeframe | Bars | 1× | 5× | 120× |
|---|---|---|---|---|
| 1m | 31,680 | 17 h 36 min | 3 h 31 min | 8 min 48 s |
| 5m | 6,336 | 3 h 31 min | 42 min | 1 min 46 s |
| 15m | 2,112 | 1 h 10 min | 14 min | 35 s |
| 1h | 528 | 18 min | 3 min 31 s | 9 s |
That is running time, without pauses to make decisions. The higher speeds are for skipping empty hours until your session: nobody can trade at 60 bars per second. You can also jump the cursor by an hour, by a day, to a time you choose or to the next news event.
Costs and run rules
A result without costs means little, so a run charges them the way a live account does.
- Commission: zero or blank means your broker's commission, as in live calculations. In MetaTrader 5 that is the fee per lot from the ticker's deals; on an exchange it is your account's taker rate.
- Spread: zero means the typical spread from history. At a broker that is the median spread of one-minute bars over the run's week. MetaTrader 5 stores the lowest spread of each minute, so the live one is wider on average, and you can set your own number. Exchange candles carry no spread, so the order book spread at the start is used.
- Swap is set per lot per day and charged at every server midnight, with a triple rate from Wednesday to Thursday.
- Risk limits, daily drawdown and losing streak, apply here too. The article on the daily loss limit covers how to choose them.
- No going back: a step back resets the account, because you can't trade the past while knowing the future. Before the first reset the terminal asks and offers to save the run to the journal.
The method has limits. If one-minute bars for a stretch aren't available anywhere, the run uses larger bars and there is no price movement inside a bar. The control bar then shows which bars the run is using. Paper money also doesn't scare anyone, so live results are often worse. You can also practise entries risk-free in a trading simulator; the difference is that a run on history builds statistics for your rules.
Where a run goes
On exit a run saves itself to the trading journal if it lasted at least 10 minutes and has at least two trades. You can save a shorter one with a button. In the journal a run is a separate source next to your live accounts, and rows with few trades are paler: it is too early to trust them. A run also gets an "Against buy and hold" tile: how much better or worse the result is than buying the instrument at the start of the window and holding to the end.
Two or three runs can be opened side by side in a comparison: equity curves together and a table with net, win rate, profit factor and drawdown. You can export a run as a file and send it to someone. They go through the same window of history blind: your trades stay hidden until their own run reaches the end.
FAQ
What is backtesting in simple terms?
It means testing trading rules on past data. You look at how the strategy would have traded before and count the result: how many trades, what share were winners, how much one trade earns on average. It is a way to find a weak spot in your rules before the market finds it.
How many trades do you need for a backtest?
At least 30, and 100 or more is better. Over 10–20 trades the result depends heavily on luck: one big winner turns the picture around. The rarer the winners in your system, the more trades you need before the average stops jumping from run to run.
Can you backtest for free?
Yes. The simplest way is to scroll a chart by hand and log trades in a spreadsheet, but then it is easy to peek at the future. A program that hides the bars to the right of the cursor and counts the result for you is more convenient. In Pulse, Backtest is part of the main program, not a paid add-on, and it works during the trial.
How is backtesting different from a demo account?
A demo runs in real time: a month of trading takes a month. Testing on history covers the same month in an evening and lets you pick any period, including a rare one such as a big news day. A demo is more honest about execution, though: prices and delays there are live.
The numbers in this article are worked examples, not trading advice. Trading on financial markets carries a risk of losing money.