BlogJournal
Trading journal: what to record and how to keep it
How to keep a trading journal: which fields it needs, which slices show where the money leaks, and why spreadsheet journals get abandoned within a week.


Contents
A trading journal is a log of closed trades where the prices and net sit next to the risk, the reason for entry and a rating of how well you followed your plan. Record what the result in R and the slices are calculated from: ticker, time, size, the stop at entry, commission. The numbers are best pulled in automatically, and only what software can't know is worth typing by hand.
What to record in a trading journal
The fields of a trade journal fall into two groups: facts your account knows, and decisions only you know.
| Field | Why | Who fills it in |
|---|---|---|
| Entry and exit date and time | slices by hour and weekday, hold time | account |
| Ticker and side | where and in which direction the system works | account |
| Size, entry and exit prices | net in money | account |
| Stop at entry | the trade's risk and the result in R | account, if the stop sat at the broker |
| Commission and swap | how much costs eat | account |
| Exit reason | stop, target, manual, rule | account or terminal |
| Setup or tag | which idea worked | you |
| Execution rating | to plan or on emotion | you |
| Note | what you saw, what you expected, what you did wrong | you |
Out of nine rows, the account fills in six. Typed in by hand, they take two or three minutes per trade, and with ten trades a day that is half an hour.
Why spreadsheet journals get abandoned
A trading journal template in a spreadsheet doesn't last long. After a bad week you don't feel like filling it in, and those are exactly the trades you need to review. Half the columns have to be worked out by hand: R, hold time, commission. A mistake in one formula quietly spoils the monthly total, and nobody notices.
That is why a good trade journal collects trades on its own and keeps the spreadsheet for exports. What is left for you is what makes a journal a journal: why you entered and how you behaved.
Money, percent and R
You can view the same selection in three units. Money shows the amount, and percent compares the result with your balance. R is for when your position size has changed: a trade that risks $10 and makes $20 is +2R, whatever the lot size was. A trade closed in full at the stop is −1R if you count the full risk, commission included.
R counts only trades that had a stop at entry, and the rest go on a separate line. That is one more reason to calculate lot size from risk and always use a stop.
Where the money leaks
Most retail traders lose money: according to the European regulator ESMA, 74–89% of retail CFD accounts lose money (press release of 27 March 2018). To see why you in particular are losing, a monthly total isn't enough, and you need slices: ticker, side, entry hour, weekday, hold time, risk per trade, exit reason, tag, place in a streak and execution rating. For each value you look at the number of trades, win rate, net, profit factor, expectancy and average R.
The most uncomfortable slice is the execution rating. Each trade gets one of three marks: to plan, broke the rules, or impulse. A sample:
| Execution | Trades | Net |
|---|---|---|
| To plan | 140 | +31R |
| Broke the rules | 38 | −6R |
| Impulse | 22 | −7R |
| All | 200 | +18R |
Trading to plan made +31R, and the 60 trades off plan took 13R back. The overall net doesn't show you that number.
The same question works for time: results by hour and by day of the week. If losses pile up in the first hour of the session or on Fridays, a map shows it in a minute. Rows with few trades are too early to trust: ten trades in a cell prove nothing yet.
How to keep a trading journal in two minutes a day
A routine people keep up for months:
- After closing a trade, a one-click execution rating and a setup tag.
- A note only for the trade that surprised you: what you saw, what you expected, what you did wrong.
- Once a week, the execution slice and the map by hour.
- Once a month, slices by ticker and setup: what to drop, what to keep.
You don't need a separate review day if the numbers are already in place. The streak slice also shows how the journal helps you hold a daily loss limit: after how many stops in a row your trades get worse.
The trade journal in Pulse Terminal
Pulse Terminal is a trading terminal for Windows whose journal collects closed trades on its own, with nothing to type in.
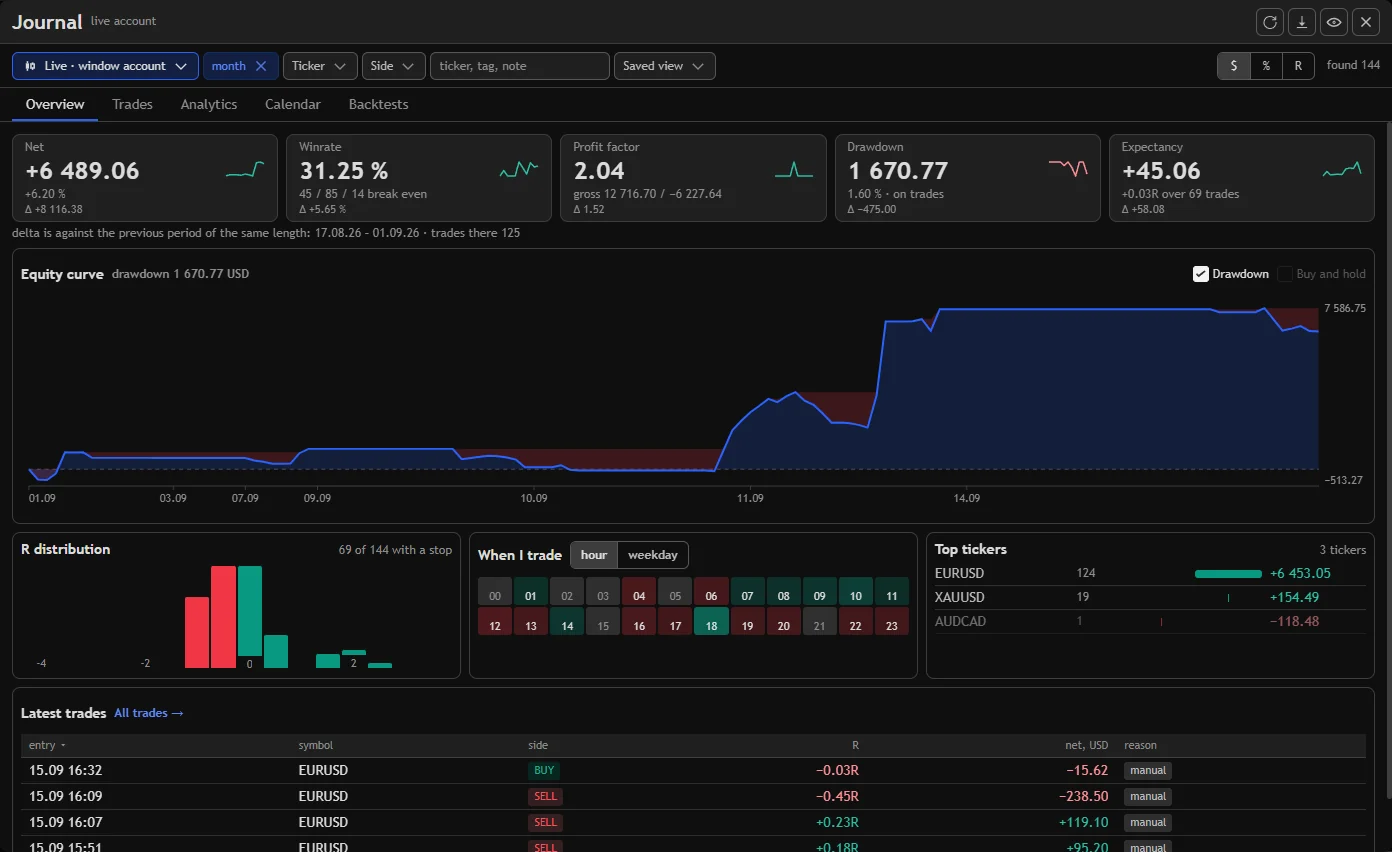
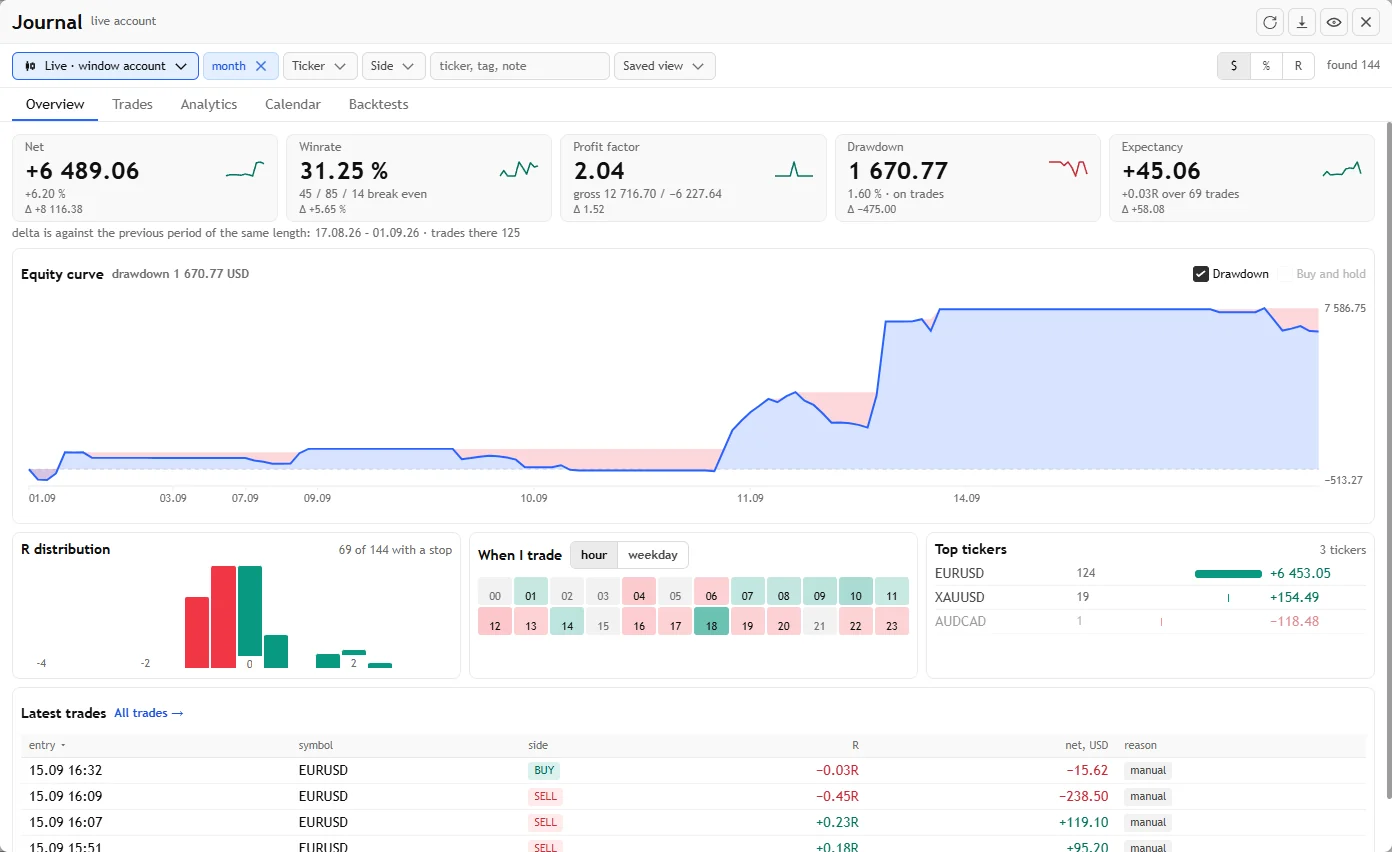
Live MetaTrader 5 and crypto exchange accounts come in on their own. Manual backtesting runs are saved to the journal on exit. A MetaTrader xlsx report becomes a separate source: the journal checks the report's times against prices and suggests the time zone. You can combine sources into one set of statistics, for example two accounts at one broker. Whatever is on screen, filters included, exports to CSV, so your data isn't locked inside the app.
The "Analytics" tab has ten slices, including "In a streak" and "Execution". The "When I trade" map shows results by hour and by day of the week, with red for a loss and green for a profit. Clicking a cell adds a condition, and all the numbers recalculate. A row with few trades is paler and marked with a dot.
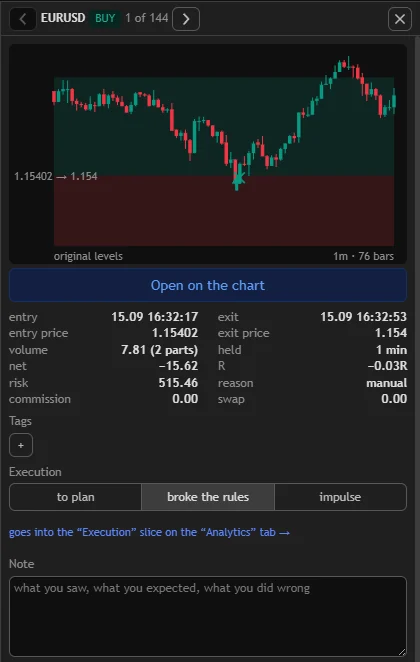
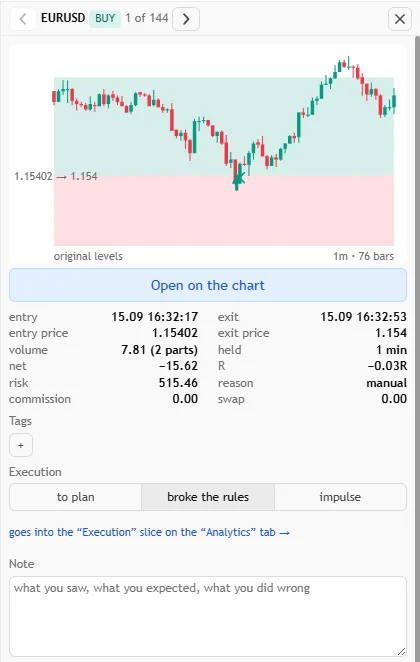
Clicking a row opens the review panel: a mini chart with the entry, exits and original stop and target levels, each part of the close with its reason, then size, R, commission and swap. "Open on the chart" opens the trade in a separate tab. There you can step through the bars from entry to exit, and trading is off in that tab. Next to it are tags from a shared dictionary, the rating and a note. The note field suggests what to write: "what you saw, what you expected, what you did wrong". Changes save themselves, and notes and ratings travel with your account to another computer.
What the journal doesn't do: exchange trades are read in seven-day windows, so over a long period only recent exchange history is available. The journal doesn't read brokers outside MetaTrader 5, and the only outside file it accepts is a MetaTrader xlsx report.
FAQ
How do you keep a trading journal properly?
Log every trade, not just the good ones, and do it right after the close. The minimum is risk, the result in R, a setup tag and an execution rating. Once a week look at the slices by execution, hour and ticker. If the numbers come in on their own, two minutes a day is enough.
Spreadsheet or app: which is better for a trade journal?
A spreadsheet is free and flexible, but you type the numbers in by hand, and after a bad week people stop filling it in. An app pulls trades from the account and calculates R, commission and slices itself. Keep the spreadsheet for exports and your own math on top.
What is the difference between a trading diary and a trade log?
A trade log is a list of facts from the account: time, prices, size, net. A trading diary adds decisions to them: why you entered, whether you followed the plan, what you noticed. The words often get mixed up, and in apps they are usually one tool.
How often should you review your trades?
A short review after every trade that surprised you. Slices by execution and time once a week, by ticker and setup once a month. Conclusions from a cell with fewer than 20–30 trades are better put off: a sample that small says nothing about the system yet.
The numbers in this article are worked examples, not trading advice. Trading on financial markets carries a risk of losing money.